For cyclists and runners who train with power, pace or heart rate.
Training analysis that never makes a number up.
Every figure here is computed from your own recorded data. The coach is handed those figures to explain. It is never asked to produce one.
In a closed test before launch. We read every request ourselves.
- 0
- numbers written by a model
- FIT · TCX · GPX · ZIP
- one file or your whole export
- EN · DE · ES
- throughout, the coach included
Works with
 Garmin Connect™


- FIT, TCX and GPX files
- History exported from other apps

You have probably met an app that does this.
Your FTP moves while you are not looking.
Up after a hard ride, down after an easy week, and you spend your evenings correcting it.
Four threshold intervals get filed as a tempo ride.
The session was scored on its average, and an average is dragged down by every recovery.
The plan changed and nothing says why.
Next week rewrote itself overnight. You are training on a decision you cannot inspect.
A gap in the data becomes a zero.
The power meter dropped for ninety seconds, so the numbers are wrong and nothing tells you.
Arithmetic you can check, on data you recorded.
Power and pace
Mean maximal curves with critical power and W′ fitted to them. Normalised power from the trace when your head unit recorded none. Grade adjusted pace for running.
Load, and whether it landed
Fitness, fatigue and form, with four readings of whether the load came at a rate a body absorbs: ramp, acute to chronic, monotony and strain.
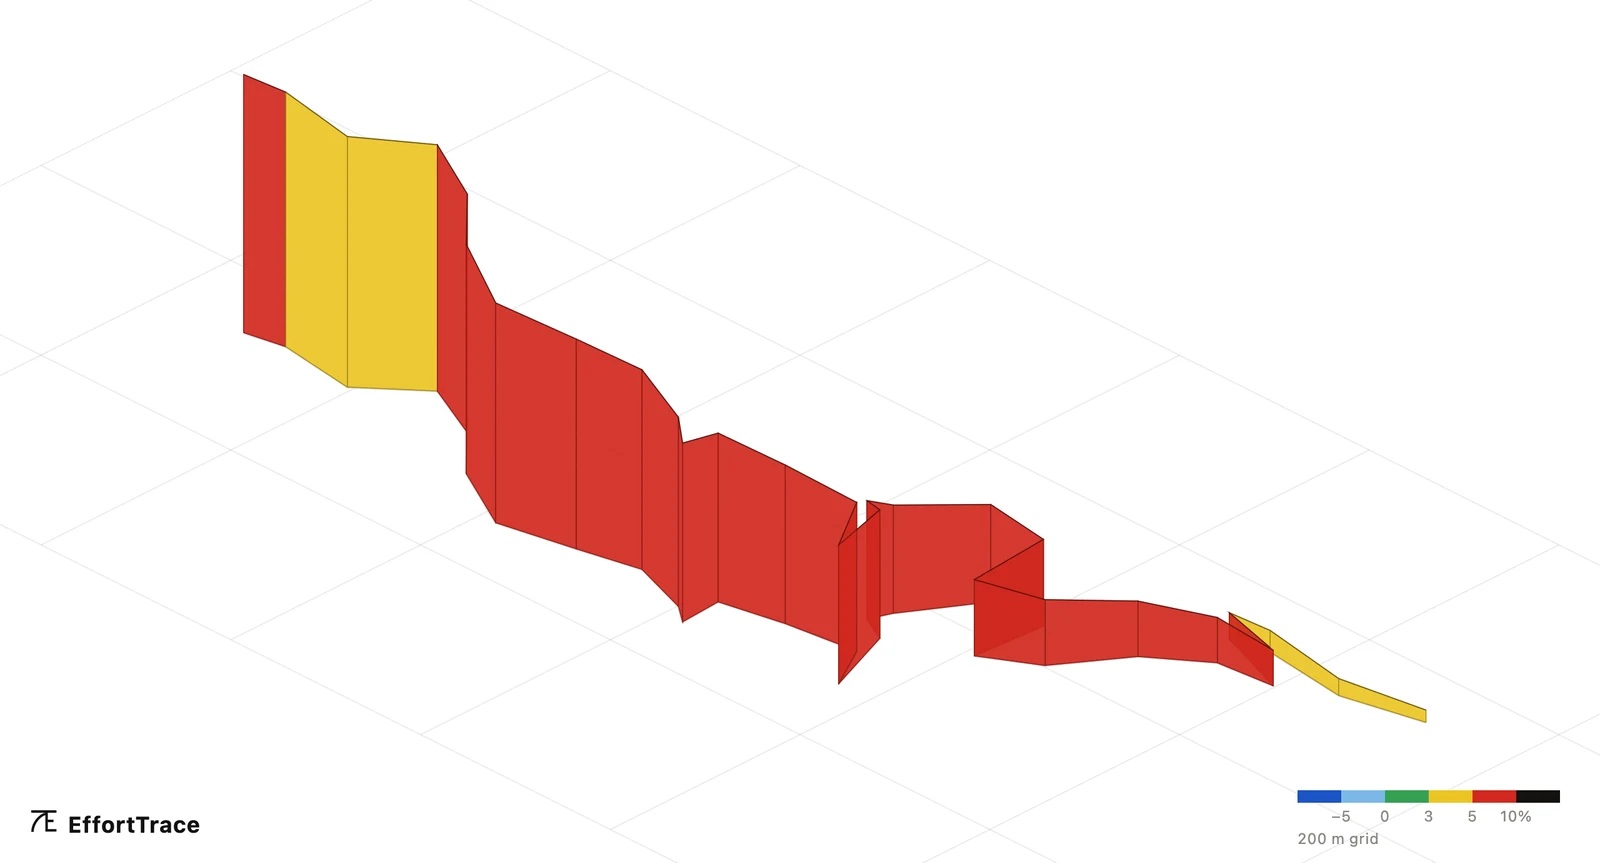
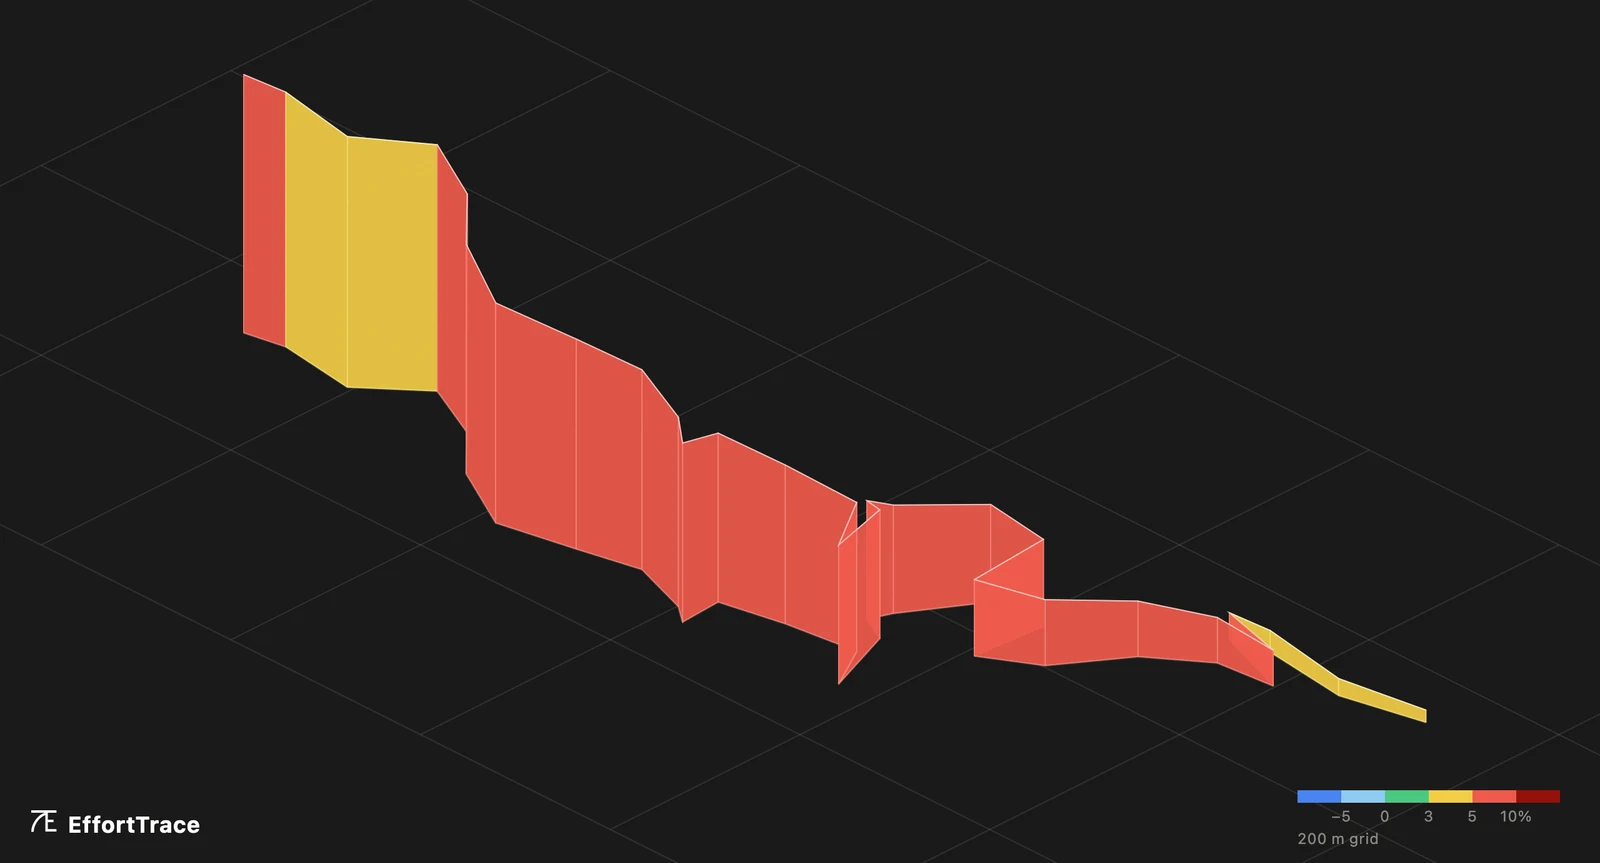
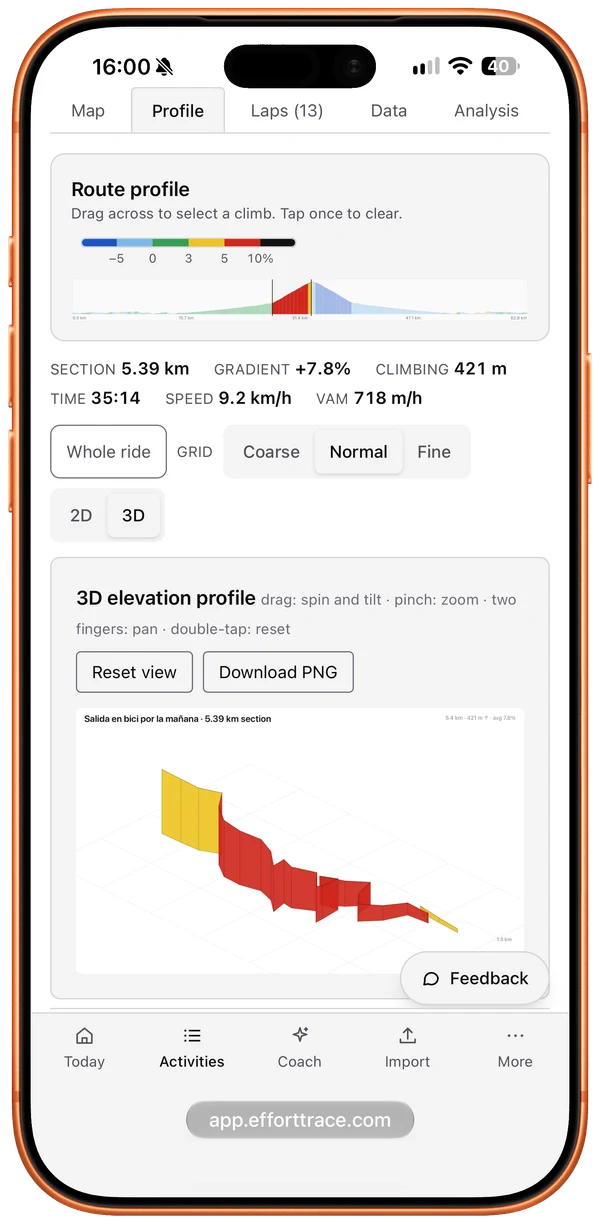
Every climb, in three dimensions.
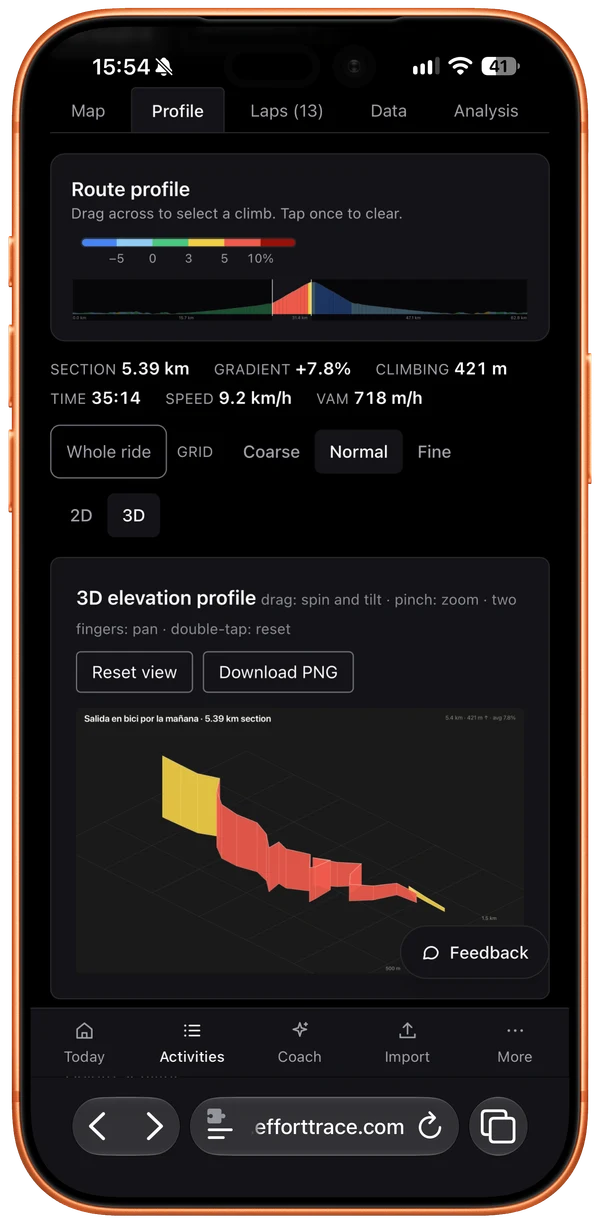
Drag across a ride's profile to pick out a climb: its length, gradient, time, speed and VAM, and the climb itself in 3D, coloured by gradient. Turn it, zoom in, and download it as an image.
Share the ride, not a screenshot.
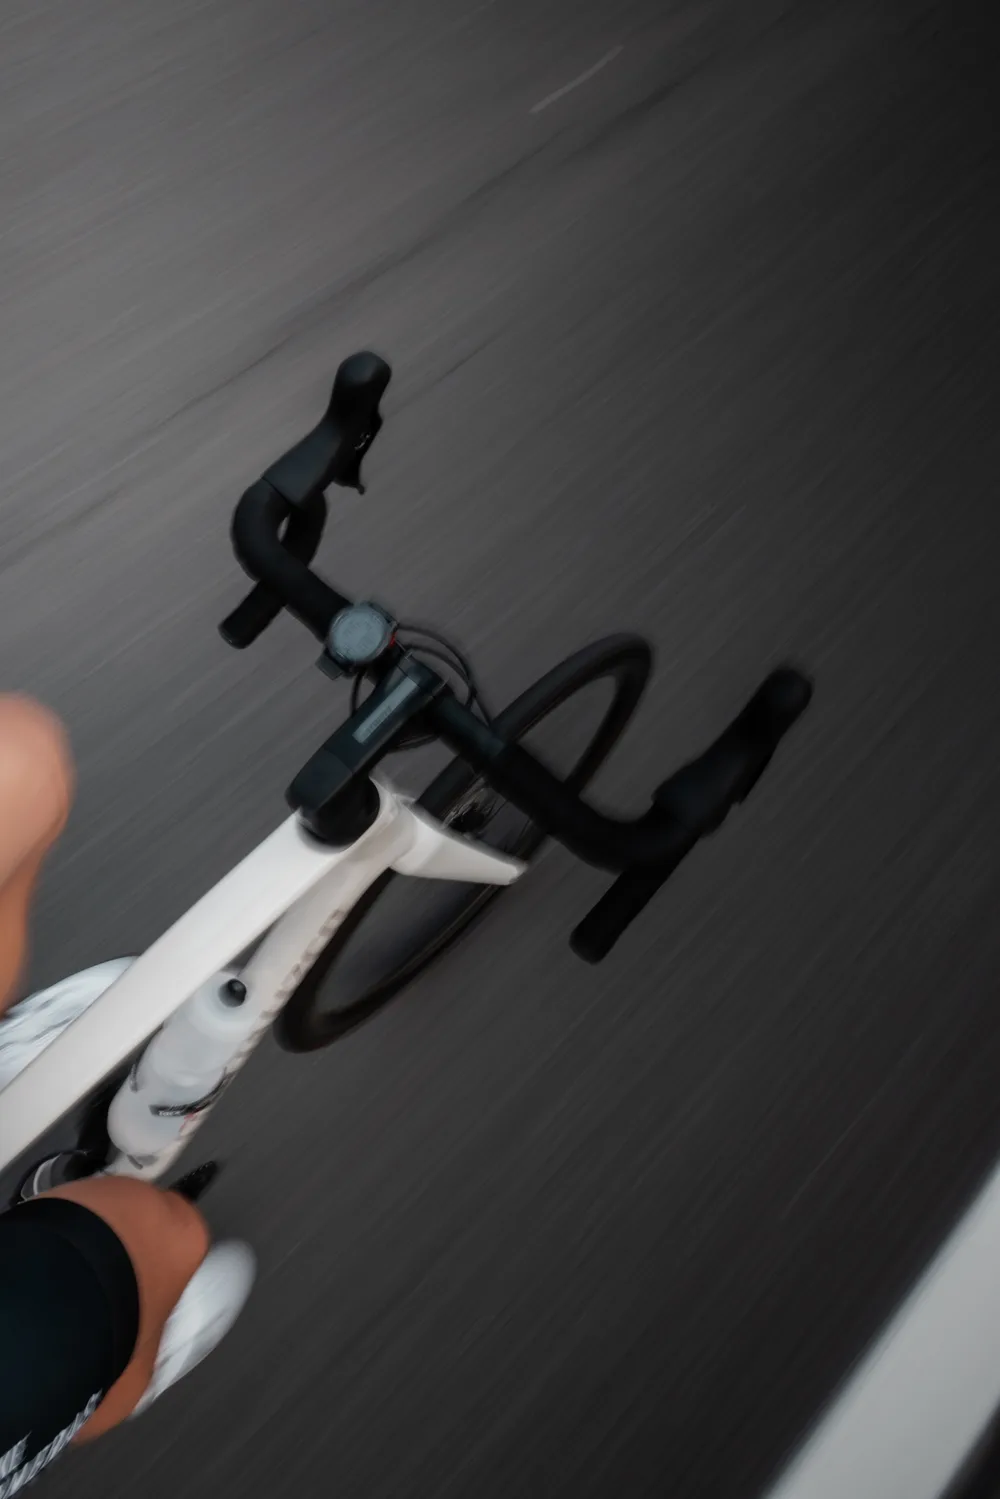
Download a card with the ride's insights, or its stats on a transparent image to lay over your own photo.
The work you actually did
Intervals found by reading the trace, not by averaging the session, alongside the laps your device recorded.
Recovery, with its reasons
HRV against your baseline, sleep against your target, resting heart rate, form. You see what moved the score.
Records
Personal bests, Eddington numbers, and race predictions as a range between two methods that disagree.
Where you have been
A heatmap of every route, segments you define yourself, time in zone, decoupling, and a 3D climb profile.
It reads your numbers. It does not invent them.
Coach
I have 75 minutes tomorrow. What should I ride?
Your form is +6 after two easy days, and your last threshold session was nine days ago. Your best 20 minutes this block is 286 W, which implies an FTP near 272 W, 24 W above the 248 W you have set.
Threshold fits. I have written it against 248 W until you decide to change your FTP: four blocks of 8 minutes at 95 to 100% of FTP, with 4 minutes easy between.
Threshold 4 × 8 min
cycling · 4 steps · ~75 min4× repeat
What it is given
Everything the app computed and everything you told it: the work blocks from the trace, your RPE and notes, the session you planned, how old your FTP is, the days you can train, and the event you are building towards.
What it cannot do
Move a figure on its own. It will tell you your best twenty minutes implies an FTP 24 W above the one you set, and changing it stays your decision.
The limit, said plainly: the instruction not to invent figures is a guardrail, not a proof. Read what it says about a number as a reading of that number, not a second source for it.
See what your last ride was actually made of.
In a closed test before launch. We read every request ourselves.
Three steps, then it is just there.
- 1
Bring your training
Upload an export or connect Wahoo or Polar. Everything is analysed on arrival, before you open a page.
- 2
Read what happened
Work blocks, time in zone, decoupling, and what the ride did to your form. Every figure traces back to the file it came from.
- 3
Decide what is next
Ask the coach, or do not. Build a session and take it away as a Zwift or FIT file. Nothing rewrites itself overnight.
Bring a decade, or connect your watch or head unit.
Your whole history, in one file
Drop the zip Strava or Garmin give you. Thousands of rides, read in one go, and uploading the same file twice is harmless.
Wahoo and Polar
Connect once and finished sessions arrive on their own, with power, heart rate and route. Polar brings your sleep and overnight HRV too.
Nothing is locked in
Export everything you have stored as one file, at any time, on any plan.
We're looking for test athletes.
EffortTrace is in a closed test before it opens to everyone. We invite a few athletes at a time, with as wide a spread of sports and devices as we can, so a small test finds a lot.
- What you get
- Plus free for the whole test: the coach, the training calendar and the workout editor, on top of all the analysis.
- What we ask
- Use it with your own training and tell us what is wrong, missing or confusing. You send feedback straight from the app.
- How it works
- Fill in the form. We read every request ourselves and email you when there is a place that fits.
The things worth asking first.
What does being a tester involve?
Use EffortTrace with your own training for a few weeks and tell us what is wrong, missing or confusing, with the feedback button in the app. It costs nothing: testers have Plus free for the whole test.
When does it open to everyone?
When the test has found what it is there to find. We don't have a date yet, and we would rather open late than open with something broken. Follow us on Instagram to hear first.
Do I need a power meter?
No. Heart rate, pace and elevation carry most of it, and running analysis is built on grade adjusted pace rather than watts. A power meter adds the curves and critical power. Where a metric cannot be computed, the app says which and why instead of showing a blank.
What does never making a number up actually mean?
Every figure is calculated in the app's own code from your files. The model receives them as facts and writes about them. It has no path to change one. Where its output is structured, a workout or a review, it is checked against a schema and rejected if it does not fit.
Can I bring my history from Strava or Garmin?
Yes. Request the full export and drop the zip on the import page. It reads the archive directly, gzipped files included, and skips anything already there.
Which devices does it connect to?
Wahoo and Polar connect directly today, and more are coming. Everything else arrives as a file, which every head unit and watch can export.
Is there a mobile app?
It runs in the browser on any device and installs to a home screen. A native iOS app with Apple Health is in progress.
What happens to my data?
It is yours. Export it as one file whenever you like, on any plan, and delete your account the same way. It is never sold, and never used to train a model.
Which languages does it speak?
English, German and Spanish throughout, the coach included.
Bring one ride. See what it says about it.
The test is small and running now. Ask for a place.
Request an invite